
Created on 2010-08-20 18:44:00
The graph traces in the AP2700 and ATS control software are automatically assigned colors each time a sweep is performed. Additionally, you can manually set the color, style, and thickness of each trace after measurements are completed. In the following, we’ll explain how the colors are automatically chosen, and we'll give you an AP Basic macro that lets you configure the traces exactly the way you want using one mouse click.
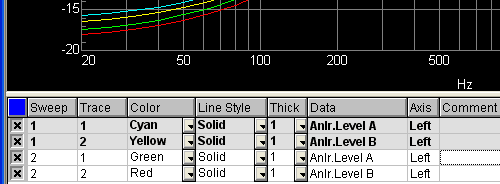
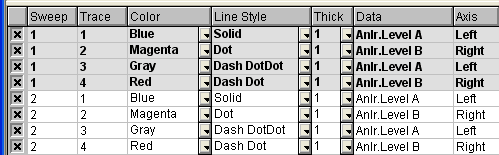
Graph legend
Overall settings for graph panel traces are found in Utilities | Configuration on the Graph tab under Trace Colors.
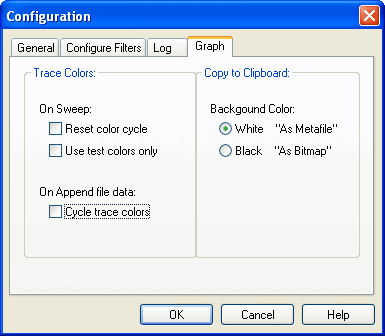
Utilities | Configuration, Graph tab
Reset Color Cycle
This option affects a sweep when it is run multiple times with the Append checkbox on the Sweep panel checked. The color cycle consists of six colors—cyan, green, yellow, red, magenta, blue, and grey—initially assigned to Sweep panel Data 1 through 6 respectively. A seventh color, gray, is not part of the color cycle.
If Reset color cycle is checked, each new appended sweep will assign the same six colors to Data 1 through 6. If Reset color cycle is unchecked, each new appended sweep will use the color cycle, but the colors assigned to Data 1 through 6 will each be advanced by one color in the cycle.
The color assignment pattern is illustrated in the chart below. The last two columns show the colors that will be assigned if you do a typical two-channel sweep, either by setting up Data 1 and Data 2, or by setting up Data 1 and checking the Stereo Sweep checkbox.
|
|
|
Reset Checked |
Reset Unchecked |
||
|
|
|
|
Data 1-6 |
Data 1,2 |
Data 1,3 (Stereo) |
|
Sweep 1 |
Data 1 |
Cyan |
Cyan |
Cyan |
Cyan |
|
Data 2 |
Green |
Green |
Green |
|
|
|
Data 3 |
Yellow |
Yellow |
|
Yellow |
|
|
Data 4 |
Red |
Red |
|
|
|
|
Data 5 |
Magenta |
Magenta |
|
|
|
|
Data 6 |
Blue |
Blue |
|
|
|
|
Sweep 2 |
Data 1 |
Cyan |
Green |
Green |
Green |
|
Data 2 |
Green |
Yellow |
Yellow |
|
|
|
Data 3 |
Yellow |
Red |
|
Red |
|
|
Data 4 |
Red |
Magenta |
|
|
|
|
Data 5 |
Magenta |
Blue |
|
|
|
|
Data 6 |
Blue |
Cyan |
|
|
|
|
Sweep 3 |
Data 1 |
Cyan |
Yellow |
Yellow |
Yellow |
|
Data 2 |
Green |
Red |
Red |
|
|
|
Data 3 |
Yellow |
Magenta |
|
Magenta |
|
|
Data 4 |
Red |
Blue |
|
|
|
|
Data 5 |
Magenta |
Cyan |
|
|
|
|
Data 6 |
Blue |
Green |
|
|
|
Trace color assignments
Use test colors only
If checked, any new or appended sweeps will use the same set of colors and options chosen for the first set. In the example below, we ran the first sweep, and then manually set the colors and line styles. Then, we ran an appended sweep. Note that even if we save and reopen the test, the settings will be saved, as long as we don’t clear the graph by selecting “New Data”. If you wish to clear the graph, but want to retain the trace settings, open the data editor panel and then highlight and delete all the rows.
"Use test colors only" checked
Printing
“Track Display Changes,” the printout will mimic the graph panel trace settings. If you quickly check and then uncheck the option, the settings from the graph panel will get transferred, and then you can modify them. You may wish, for example, to change the line width to optimize the printout for a particular printer.
AP Basic Macros
The most robust control of the trace properties is provided by using the API interface in a macro. For example, the following code will set the first trace of the first sweep to a solid green line with thickness “6”, and will add the comment "Left Channel THD+N."
AP.Graph.Legend.LineColor(1, 1) = apbGreen
AP.Graph.Legend.LineThickness(1, 1) = 6
AP.Graph.Legend.LineStyle(1, 1) = apbSolid
AP.Graph.Legend.Comment(1, 1) = "Left Channel THD+N."
We’ve written a short stand-alone AP Basic macro that lets you set the graph trace properties quickly, even if you aren’t otherwise using macros or automation for your testing. By adding the macro to your Quick Launch toolbar, you can configure the graph and printout properties by simply clicking an icon after running your sweeps. If you wish to have an alternate set of properties, simply edit the macro as desired, resave it with a new name, and create another icon on the Quick Launch toolbar for it. Installation instructions are included with the macro download.
RELATED DOWNLOADS
AP2700 and ATS Graph Trace Setting Macro
ets you set the graph trace properties quickly (line color, thickness, pattern, comments), even if you aren't otherwise using macros or automation, by adding this macro to your Quick Launch toolbar. Zip file includes macros for AP2700 and ATS, and Quick Launch installation instructions.